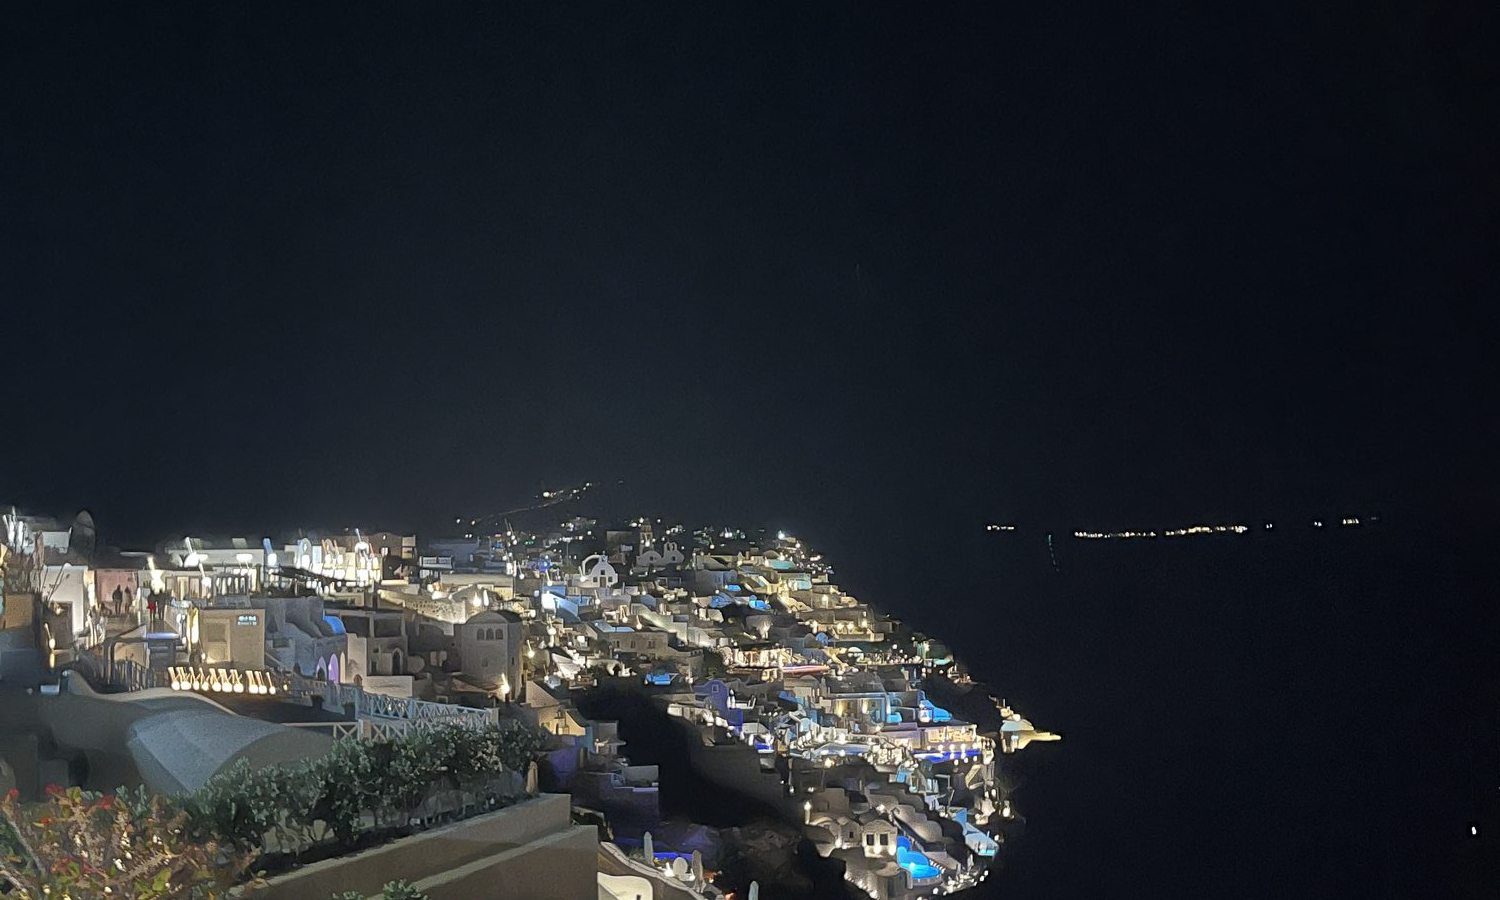
The Overrated Index — which famous places are most overrun.
31 destinations ranked by how much attention each draws against how many people actually live there.
Every year the same argument goes round: this place is overrated, that one is a tourist trap. It is almost always opinion. This is the version with the arithmetic shown.
The index measures one thing, deliberately: how much attention a destination attracts relative to the number of people who live there. That ratio is the mechanism behind almost every complaint about a place being ruined — not that it is ugly, but that its fame has outgrown it.
What it measures
The gap between how famous a place is and how much of it there is to go round. Crowding pressure, in one number.
What it does not
Whether you will enjoy yourself. No satisfaction score, no review sentiment, no verdict on beauty. A high rank is not a warning.
Why small places rank high
It is a ratio, so a village will always out-score a capital. That is the point of the measure — use the tier filters to compare like with like.
The index
31 destinations, ranked
The top of the table is not a list of bad places. It is a list of small ones. Hallstatt, a village of 741 people, drew 209,423 page views in twelve months. At the other end, Bali draws more attention in absolute terms than most of this table, but spread across 4,362,700 residents it barely registers.
| # | Destination | Views per resident | Page views (12 mo) | Residents | Season ratio | Busiest month |
|---|---|---|---|---|---|---|
| 1 | HallstattAustria209,423 views · 741 residents · peak Dec 2025 | 282.6 | 209,423 | 7412026 | 1.39 | Dec 2025 |
| 2 | Cinque TerreItaly332,788 views · 3,405 residents · peak Aug 2025 | 97.7 | 332,788 | 3,405— | 1.34 | Aug 2025 |
| 3 | PositanoItaly143,703 views · 3,729 residents · peak Sep 2025 | 38.5 | 143,703 | 3,7292024 | 1.72 | Sep 2025 |
| 4 | SantoriniGreece414,452 views · 17,430 residents · peak Aug 2025 | 23.8 | 414,452 | 17,4302011 | 1.35 | Aug 2025 |
| 5 | AmalfiItaly95,991 views · 4,729 residents · peak May 2026 | 20.3 | 95,991 | 4,7292023 | 1.19 | May 2026 |
| 6 | CapriItaly246,648 views · 12,903 residents · peak Oct 2025 | 19.1 | 246,648 | 12,9032022 | 1.48 | Oct 2025 |
| 7 | MykonosGreece171,312 views · 10,134 residents · peak Jul 2026 | 16.9 | 171,312 | 10,1342011 | 1.53 | Jul 2026 |
| 8 | DubrovnikCroatia399,433 views · 41,562 residents · peak Aug 2025 | 9.6 | 399,433 | 41,5622021 | 1.43 | Aug 2025 |
| 9 | SorrentoItaly118,978 views · 15,407 residents · peak Jun 2026 | 7.7 | 118,978 | 15,4072023 | 1.58 | Jun 2026 |
| 10 | ReykjavikIceland662,771 views · 138,772 residents · peak Jan 2026 | 4.8 | 662,771 | 138,7722025 | 1.33 | Jan 2026 |
| 11 | CorfuGreece452,292 views · 100,854 residents · peak Aug 2025 | 4.5 | 452,292 | 100,8542011 | 1.34 | Aug 2025 |
| 12 | VeniceItaly1,078,233 views · 250,369 residents · peak Aug 2025 | 4.3 | 1,078,233 | 250,3692023 | 1.18 | Aug 2025 |
| 13 | RhodesGreece431,076 views · 127,613 residents · peak Aug 2025 | 3.4 | 431,076 | 127,6132020 | 1.43 | Aug 2025 |
| 14 | BrugesBelgium401,015 views · 118,509 residents · peak Jul 2026 | 3.4 | 401,015 | 118,5092022 | 1.26 | Jul 2026 |
| 15 | SplitCroatia414,380 views · 160,577 residents · peak Aug 2025 | 2.6 | 414,380 | 160,5772021 | 1.56 | Aug 2025 |
| 16 | EdinburghScotland1,074,465 views · 488,050 residents · peak Aug 2025 | 2.2 | 1,074,465 | 488,0502016 | 1.28 | Aug 2025 |
| 17 | FlorenceItaly731,405 views · 360,930 residents · peak Aug 2025 | 2.0 | 731,405 | 360,9302023 | 1.14 | Aug 2025 |
| 18 | AthensGreece912,686 views · 643,452 residents · peak Oct 2025 | 1.4 | 912,686 | 643,4522021 | 1.13 | Oct 2025 |
| 19 | LisbonPortugal774,254 views · 545,796 residents · peak Sep 2025 | 1.4 | 774,254 | 545,7962021 | 1.35 | Sep 2025 |
| 20 | AmsterdamNetherlands1,166,229 views · 921,468 residents · peak Aug 2025 | 1.3 | 1,166,229 | 921,4682023 | 1.18 | Aug 2025 |
| 21 | BergenNorway310,850 views · 291,189 residents · peak Jul 2026 | 1.1 | 310,850 | 291,1892023 | 1.31 | Jul 2026 |
| 22 | LyonFrance534,023 views · 519,127 residents · peak Jul 2026 | 1.0 | 534,023 | 519,1272023 | 1.10 | Jul 2026 |
| 23 | PragueCzechia1,269,680 views · 1,397,880 residents · peak Oct 2025 | 0.9 | 1,269,680 | 1,397,8802025 | 1.18 | Oct 2025 |
| 24 | ParisFrance1,823,861 views · 2,103,778 residents · peak Jun 2026 | 0.9 | 1,823,861 | 2,103,7782023 | 1.17 | Jun 2026 |
| 25 | Quebec CityCanada501,193 views · 574,482 residents · peak Aug 2025 | 0.9 | 501,193 | 574,4822024 | 1.19 | Aug 2025 |
| 26 | NaplesItaly788,573 views · 913,462 residents · peak Aug 2025 | 0.9 | 788,573 | 913,4622023 | 1.18 | Aug 2025 |
| 27 | BarcelonaSpain1,208,847 views · 1,731,649 residents · peak Jul 2026 | 0.7 | 1,208,847 | 1,731,6492025 | 1.36 | Jul 2026 |
| 28 | MontrealCanada1,198,240 views · 1,895,211 residents · peak May 2026 | 0.6 | 1,198,240 | 1,895,2112024 | 1.16 | May 2026 |
| 29 | RomeItaly1,461,003 views · 2,748,109 residents · peak Oct 2025 | 0.5 | 1,461,003 | 2,748,1092023 | 1.09 | Oct 2025 |
| 30 | KyotoJapan645,450 views · 1,463,723 residents · peak Nov 2025 | 0.4 | 645,450 | 1,463,7232020 | 1.42 | Nov 2025 |
| 31 | BaliIndonesia1,227,948 views · 4,362,700 residents · peak Aug 2025 | 0.3 | 1,227,948 | 4,362,7002021 | 1.23 | Aug 2025 |
| — | Machu PicchuPeru1,327,392 views · peak Sep 2025 | — | 1,327,392 | — | 1.33 | Sep 2025 |
| — | PompeiiItaly1,137,118 views · peak Jul 2026 | — | 1,137,118 | — | 1.34 | Jul 2026 |
| — | PetraJordan1,000,919 views · peak Sep 2025 | — | 1,000,919 | — | 1.29 | Sep 2025 |
No destination matches that search.
Rows marked with a red rule are places we have been to and written about — the link takes you to the honest verdict. Residents carry the census or estimate year recorded in Wikidata. Sites have no resident population, so they cannot be ranked.
Method
How the number is built
The whole index rests on two free, public, machine-readable sources. No survey, no paid panel, no proprietary data — deliberately, so anyone who wants to check this can rebuild it.
1 · Attention
English Wikipedia page views for the twelve complete months from August 2025 – July 2026, via the Wikimedia REST pageviews API, restricted to agent=user so automated traffic is excluded.
2 · Residents
Population from Wikidata property P1082 — the value Wikidata itself marks preferred where one is set, otherwise the most recently dated figure. Each figure’s year is printed in the table.
3 · The ratio
Annual page views divided by population. That is the ranking, and it is the whole calculation.
4 · Season concentration
The busiest month’s page views divided by the twelve-month mean. Reported beside the ratio, never folded into it.
We deliberately do not blend the two numbers into a single score. Any weighting would be a choice we could not defend — why 70/30 and not 60/40? — and an index whose headline depends on an arbitrary constant is a stunt. Two honest numbers side by side beat one invented one.
Limitations
Where this index is weak
Stated here rather than buried, because a study that hides its own weaknesses is a press release.
Interest, not arrivals
Someone reading about Hallstatt may never go. This is an attention proxy, not a substitute for tourist-board arrival figures — which are not published consistently enough across 34 destinations to use.
English Wikipedia only
That biases the sample toward destinations anglophone travellers research. Kyoto almost certainly draws attention in Japanese that this method never sees.
Boundaries are inconsistent
Some population figures are municipal, some cover a wider commune or a whole island. Athens is counted as the municipality, not its much larger urban area, so it reads lower here than a metro figure would.
Three census years matter
Santorini, Mykonos and Corfu carry 2011 figures — the most recent Wikidata holds. Greek island populations generally fell over that decade, so those three are, if anything, ranked too low. We publish the bias and its direction rather than quietly patching rows.
Reading is less seasonal than travel
People read year round and travel in August, so the season ratios here understate real seasonality. Treat them as relative, not absolute.
The sample is chosen
These 34 destinations were selected as well-known places, several of which we have written about first hand. A different list would produce a different table.
Use the data
Cite it, check it, argue with it
The index is published so it can be quoted and checked. Every raw figure behind the table — including monthly page views for each destination — is in one JSON file.
Data: English Wikipedia page views, August 2025 – July 2026; Wikidata population.
Dataset: pontus.life/overrated-index-2026.json
If a number here looks wrong, we would genuinely like to know — hello@pontus.life. The 2027 edition rebuilds from the same two sources, so the movement between years becomes the more interesting number.
Questions
Common questions
What does the Overrated Index actually measure?
It measures attention per resident: how many times a destination's English Wikipedia page was read over twelve months, divided by the number of people who live there. A high score means a place is famous far out of proportion to the size of the community absorbing the visitors. It does not measure whether you will enjoy the place, and it is not a visitor count.
Which destination is the most overrated in 2026?
By this measure Hallstatt ranks first, with 209,423 page views against 741 residents — 282.6 views per resident, roughly 1,009 times the figure for Bali at the bottom of the table. It is a village of a few hundred people carrying the search interest of a major city.
Is Santorini overrated?
Santorini ranks 4 of 31 on this index, at 23.8 page views per resident. That is a crowding signal, not a verdict on the island. Our own first-hand position is that Santorini is not overrated so much as wrongly visited — the caldera at sunset is genuinely extraordinary and genuinely mobbed, and the two facts are related.
Why are big cities like Rome and Paris near the bottom?
Because they are large enough to absorb their own fame. Rome draws far more attention than Hallstatt in absolute terms, but it has millions of residents to carry it. The index is a ratio, so size is the whole point — and that is a property of the measure, not a flaw hidden inside it. Use the tier filters to compare like with like.
What data is the index built from?
Two free, public, machine-readable sources: the Wikimedia REST pageviews API for attention, and Wikidata for resident population. No paid data, no surveys, no proprietary panel. The full dataset is published as JSON so anyone can check the arithmetic or rebuild the table.
Does a high score mean I should not go?
No. It means go differently — outside the peak month, staying overnight rather than arriving with a cruise or a day tour, and expecting to be one of many. Every destination near the top of this table is famous for a reason.
First hand
Where we have actually been
The data says how crowded a place is. Only going says what it is like. These are the destinations in the table we have walked, photographed and written an honest verdict on.
- Positano vs SorrentoPositano, Italy
- Our honest verdict on whether Santorini is overratedSantorini, Greece
- Athens vs SantoriniSantorini, Greece
- Where to base yourself on the Amalfi CoastAmalfi, Italy
- Mykonos vs SantoriniMykonos, Greece
- Five days on CorfuCorfu, Greece
- Our Athens guideAthens, Greece
- Five days in LyonLyon, France
- Lyon vs ParisLyon, France
- Quebec CityQuebec City, Canada
- Quebec City or MontrealQuebec City, Canada
- Naples vs RomeNaples, Italy
- Is Pompeii worth visitingPompeii, Italy
- Pompeii or HerculaneumPompeii, Italy
The wider picture sits in our country guides — the honest guide to Greece and the honest guide to Italy — and the argument this index puts numbers to is made in words in the most overrated destinations. Every verdict we publish is collected in the reviews directory and mapped on the globe.